Lovable Analytics: What It Counts, and What It Can't
Lovable analytics is built into every plan and starts counting the moment you publish. It tells you how many visits your app gets, which pages they see, where they came from and what devices they use, without setting a single cookie. What it doesn’t tell you is whether anyone signed up or paid. For that you still need a product analytics tool next to it, and the gap matters more than most founders expect.
Everything below is from Lovable’s analytics docs, checked November 3, 2026.
What the built-in analytics shows
Open your project’s analytics and you get a chart with five numbers: visits, page views, views per visit, visit duration and engagement rate. Underneath are three breakdowns: sources, pages, and a visitor profile with countries and device types. Traffic is split into channels: SEO and AI, social, referral, direct and ads. “Current visits” counts the visits active in the last five minutes, which is as close to real time as it gets.
The default range is the last 7 days. You can pick any range inside the last 90 days, and the dates are in UTC, so a “today” view for a US founder starts in the evening of the day before.
Two details that catch people out:
- Visits are not people. The docs say it directly. Someone who opens your app on their phone at lunch and their laptop at night is two visits.
- The numbers changed on October 26, 2026. Lovable changed how it counts visits that day, and engagement rate replaced bounce rate for any period that starts after it. So if your October looks better or worse than September, compare carefully before you celebrate.
No cookies, so no banner for it
The built-in analytics “sets no cookies and stores nothing in your visitors’ browsers.” Each visit gets a random id that’s thrown away when the visit ends. That’s why it can’t count unique people, and it’s also why it doesn’t need a consent banner the way Google Analytics usually does for visitors in the EU and UK. If your app has visitors there and all you need is traffic, this is the simplest setup you’ll find.
What it can’t tell you
The docs are honest about this too: the built-in analytics doesn’t track steps like sign-up or purchase, and it suggests connecting “a dedicated analytics tool such as PostHog.” So it can tell you that 1,200 people visited your pricing page last week. It can’t tell you that 40 of them started checkout and 9 finished, or which ad campaign those 9 came from. UTM tags are used to sort traffic into channels, but visits aren’t grouped by campaign name.
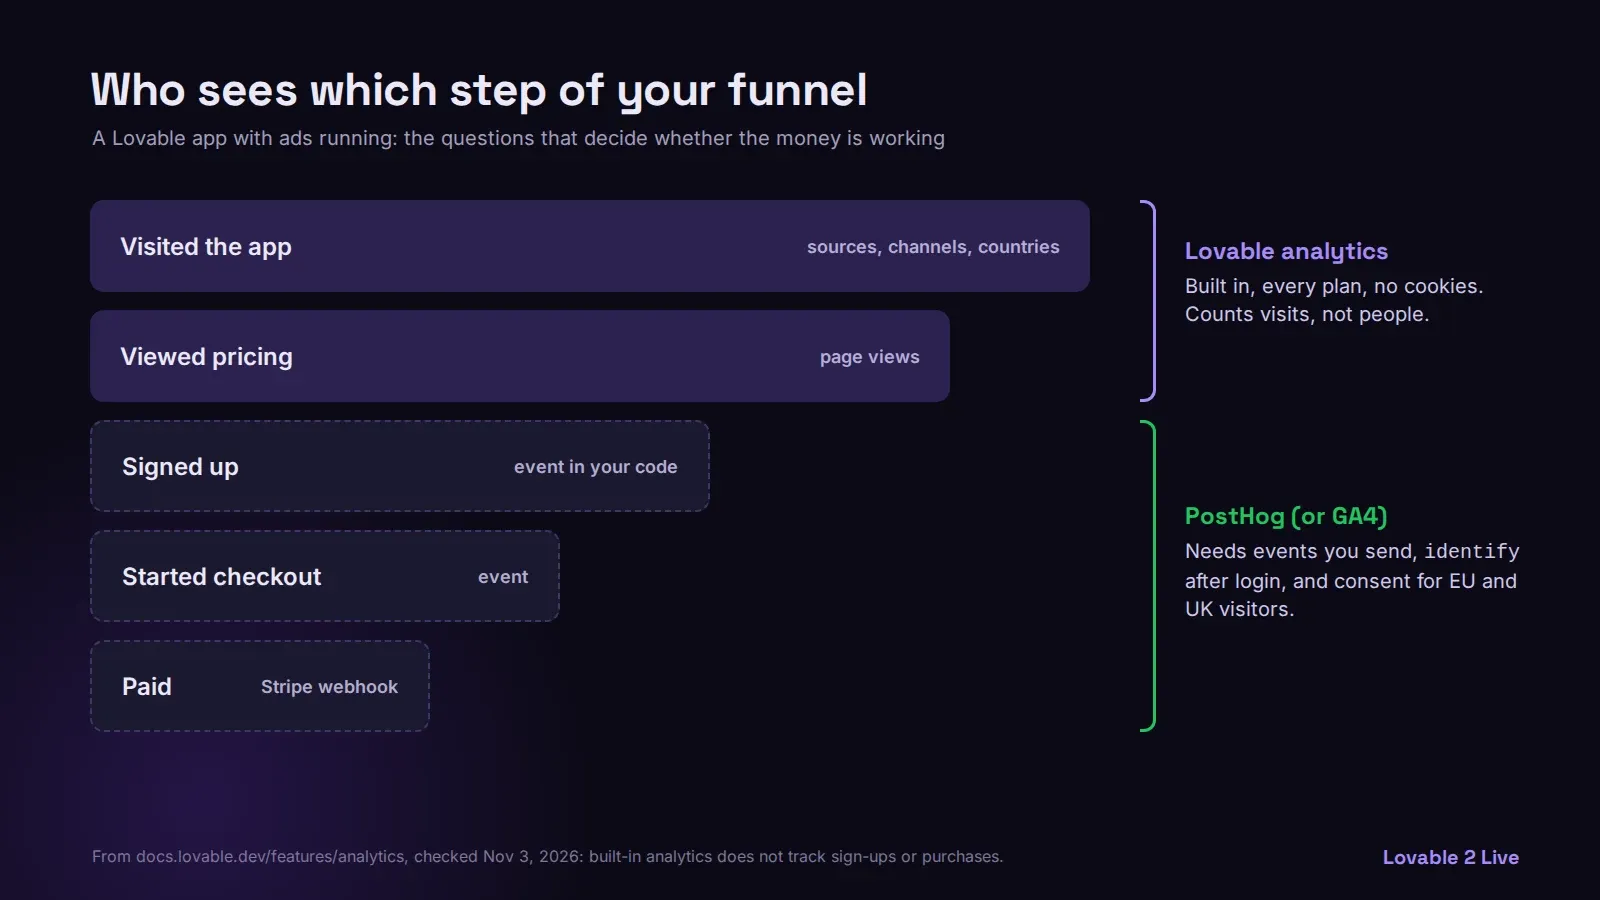
That’s the part a growing app needs most. Once you’re paying for ads or testing a new onboarding, “visits” is a vanity number. What you want is the funnel: visited, signed up, did the main thing, paid, came back.
Adding PostHog or GA4 to a Lovable app
You can ask the Lovable agent to add either one, and it usually gets the snippet in. Where it goes wrong is the part after the snippet:
- Events. A pageview script alone won’t track sign-ups or payments. Each event (
signed_up,checkout_started,subscription_paid) has to be sent from the right place in your code, and payments are best sent from the server, in the Stripe webhook, so an ad blocker can’t hide them. - Identifying users. Call
identifywith your user’s id after login, or every session looks like a new person and your retention charts are wrong. PostHog’s identify docs explain it well. - Consent. PostHog and GA4 set cookies by default. With EU or UK visitors you need a consent banner, or you run PostHog in cookieless mode. Google’s consent mode guide covers the GA4 side.
- Your own visits. Exclude your team, or your numbers in the first months are mostly you.
Keep the built-in analytics on as well. It costs nothing, needs no cookies, and gives you a second count to check the other tool against. If the two disagree a lot, a script is broken or blocked.
Where this fits before launch
Analytics is one of the boring jobs that separates a demo from a product, next to backups, error monitoring and a security review, and our post on how to make a Lovable app production ready goes through them in order. If you’d rather hand those to someone, that’s our Lovable to production service: from $500, 5 to 7 days, and the funnel events are part of it. Wondering what your app will cost to run once traffic grows? The free Lovable cost check reads your repo and tells you.